

Getting started with the Benthomap fishery condition analysis tool.
- Benthomap
- Jul 19, 2024
- 2 min read
Updated: 7 days ago
The Benthomap fishery condition tool offers two methods for data input. Users have the option to either upload a CSV file with properly formatted data or input the data directly into the tool, streamlining the process and preventing multiple data entry steps. If your data are already in CSV format, the column headers and species names must be formatted as in the example below to facilitate proper uploading. Fish species that are currently allowed are Largemouth Bass, Bluegill, and Redear Sunfish.

Once the CSV file is properly formatted, select the units of measure for the dataset. Acceptable standard units are inches for length and pounds for weight. Acceptable metric units are millimeters for length and grams for weight. If uploading a CSV, the unit selection must be the same as the units present in the CSV.

Important Note: For proper analysis, units must be consistent throughout the dataset.
Browse to your CSV file or drag and drop it into the tool. The table to the right should populate with data. If not, the CSV formatting could be incorrect.

If entering data manually, select the species of fish, enter the length and weight, and click "add fish". Repeat these steps for all fish in your dataset.

Mistakes can be corrected using the "Remove Last Fish" button. This will only remove the last row of data in the table. To clear the table, use the "Clear All Data" button.

Following these steps, data can be added to or removed from the table even if a CSV has already been uploaded.
Finally, users may enter a name for the study, a data collection date, and a data collector or client's name. This information will appear in file names and at the top of reports.

The length frequency tab will show results of the length frequency analysis of each species, in which each bar represents the frequency of a length range. Species can be changed using the dropdown menu.

The relative weight tab shows a plot of the length and weight of each individual fish along the standard weight curve and a chart of the average relative weight of each length class.


The report tab compiles all analyzed datasets and graphs into an interactive report containing information pertinent to each analysis. Users can download this report from the downloads tab.

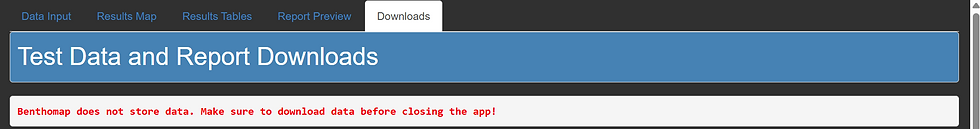
The downloads tab allows users to download raw data, processed datasets resulting from analysis, and an interactive or PDF report.
NOTE: Benthomap tools do not store data. All datasets and reports must be downloaded and saved locally or they will be lost.
The following reports and data are available for download:
Raw fish data with standard and relative weights of each fish (.csv)
Interactive report (.html)
Printer friendly report (.pdf)

Comments